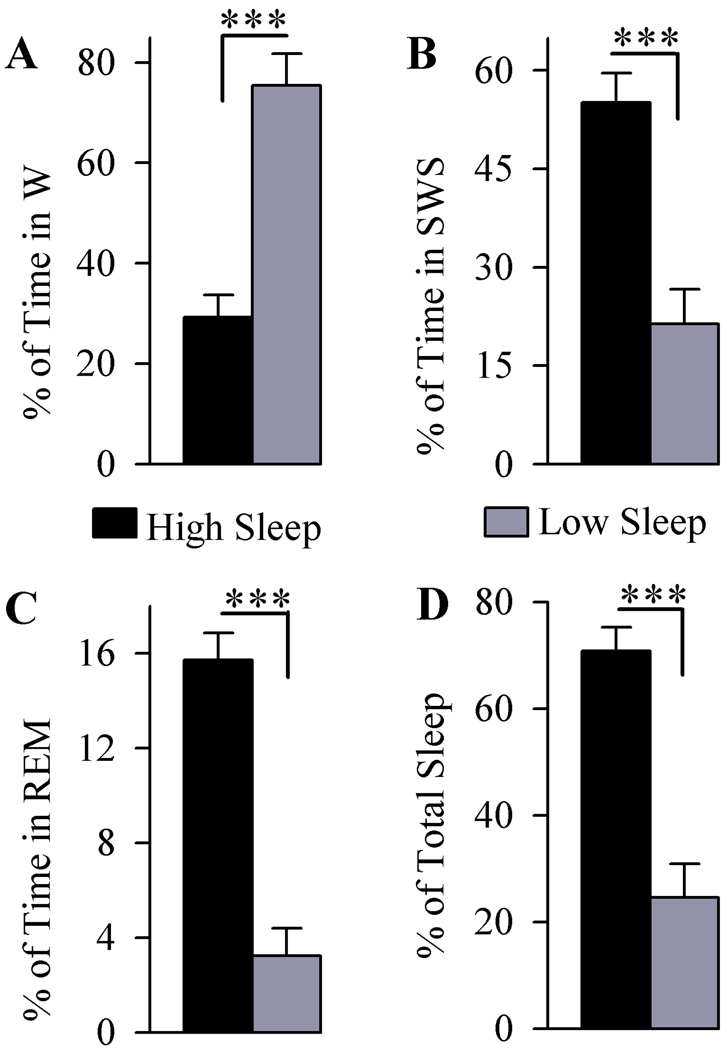
Figure 1.
Analysis of the total percentage (mean and SEM) of time spent in wakefulness (W; A), slow-wave sleep (SWS; B), rapid eye movement sleep (REM sleep; C) and total sleep (D) in animals used for expression and phosphorylation of ERK 1/2. Examination of the total time spent in W (A) revealed that the high sleep group spent less time in W compared to low sleep group. Analysis of the total time spent in SWS (B) and REM sleep (C) revealed that the high sleep group spent more time than low sleep group did in SWS and REM sleep. Overall, the high sleep group spent more time in sleep than the low sleep group (D). *** p<0.001.

