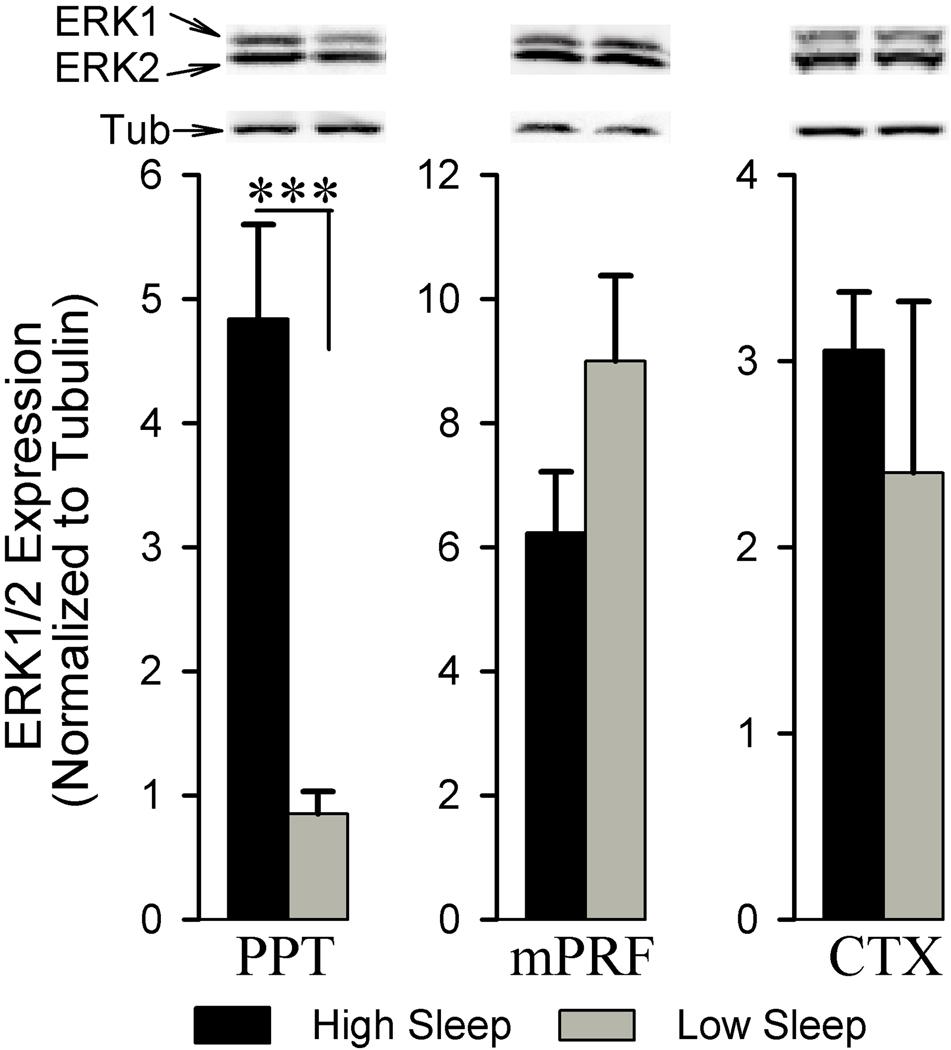
Figure 2.
Analysis of ERK1/2 expression in the pedunculopontine tegmentum (PPT), medial pontine reticular formation (mPRF), and cortex (CTX) of high and low sleep subjects. Densitometric measurements from western blot of ERK1/2 expression in the PPT revealed a significant increase (466.53%) in the high sleep group compared to the low sleep group. In contrast, western blot analysis of ERK1/2 expression in the adjacent mPRF and the CTX revealed no significant difference between the high and low sleep groups. All analyses of ERK1/2 expression are normalized against α-tubulin. *** p<0.001.

