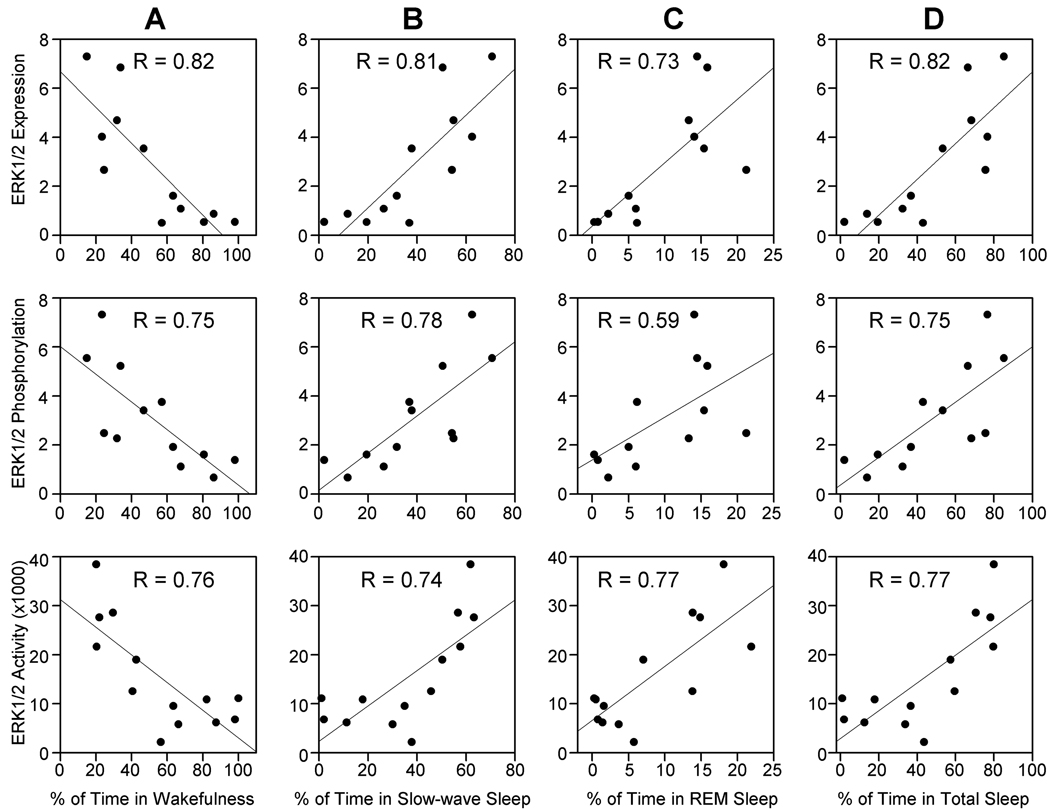
Figure 6.
The relationships between the levels of ERK1/2 expression, phosphorylation, and activation in the PPT and percentages of time spent in wakefulness (A), slow-wave sleep (B), REM sleep (C), and total sleep (D). Linear regression analyses showed negative correlation between ERK1/2 expression, phosphorylation, and activity within the PPT and individual animals’ total percentage of time spent in W (A), whereas ERK1/2 expression, phosphorylation, and activity within the PPT were positively correlated with individual animals’ total percentage of time spent in SWS (B) REM sleep (C) and total sleep (D). For each linear regression analysis, the correlation coefficient (R) is indicated in the respective graph.

