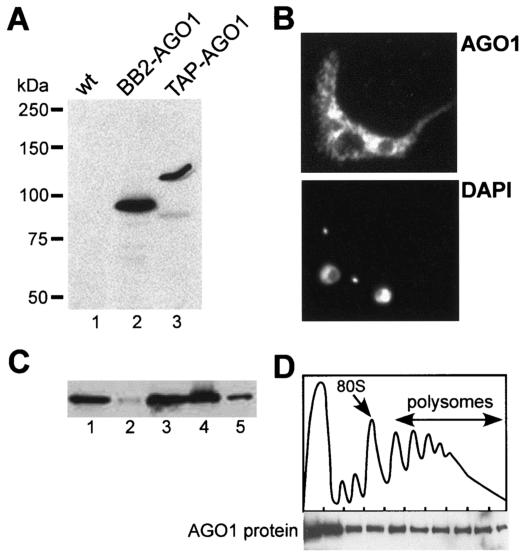
FIG. 3.
Cellular localization of AGO1. (A) Western blot with anti-BB2 antibodies of extracts from wild-type (lane 1), BB2-tagged AGO1 (lane 2), and TAP-tagged AGO1 (lane 3) cells. (B) Cells expressing TAP-tagged AGO1 were processed for indirect immunofluorescence as described previously (26) by staining with a rabbit anti-protein A antibody (subpanel AGO1). DNA was stained with 4′,6′-diamidino-2-phenylindole (subpanel DAPI). The small dots represent the kinetoplast DNA. (C) Western blot of TAP-tagged AGO1 with a rabbit anti-protein A polyclonal antibody of equivalent amounts of total extract (lane 1), postnuclear pellet (lane 2), supernatant (lane 3), S100 fraction (lane 4), and ribosomal pellet (lane 5). (D) Sucrose density gradient analysis of a cytoplasmic extract from T. brucei cells expressing TAP-tagged AGO1 (9). The upper panel shows the absorbance profile at 254 nm, and the positions of the 80S monosome and polyribosomes are indicated. The lower panel shows a Western blot analysis of the sucrose density gradient fractions using a rabbit anti-protein A polyclonal antibody.

