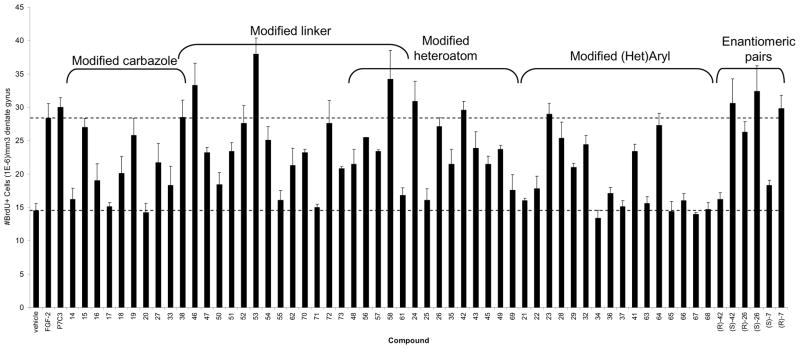
Fig 3. Analysis of synthetic analogs.
In vivo analysis of synthetic analogs of P7C3. Data are expressed as mean ± SEM, 4 mice/compound except compound 56 (1 mouse). Compounds were infused ICV as a 10 μM solution introduced at a constant rate (12 μL/day) over 7 days. Brackets indicate portion of analog that differs from P7C3.

