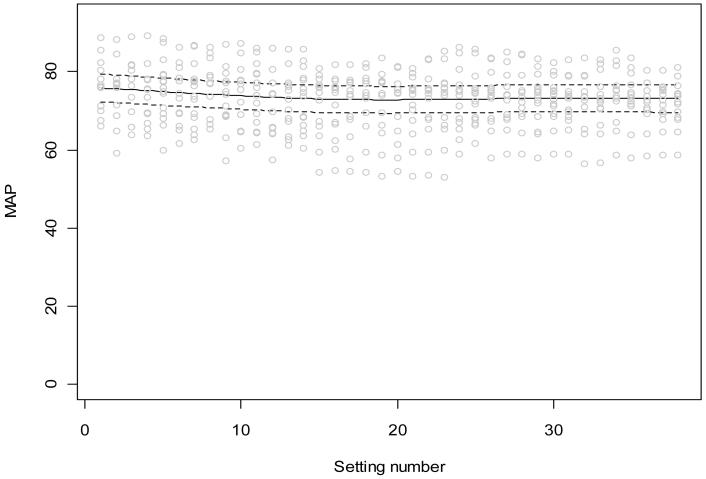
Figure 3.
Phasic variation of the mean arterial pressure during BiVP optimization using 38 settings in Phase 1 of the BiPACS trial. Data for 15 patients; we first used an additive mixed effects model allowing a flexible trend. If this model suggested a linear trend, we used a linear mixed effects model. Random subject effects were included in both models to account for the within-subject correlation due to repeated measures from the same subject. There is a significant nonlinear trend (p<0.001).

