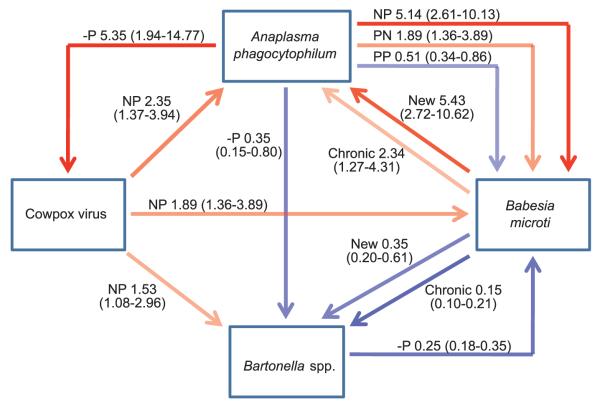
Fig. 1.
The web of interactions between microparasite species within this community, showing the magnitude of effects. All associations shown obtained overwhelming support (accumulative weight in models >0.9) (see table S3). Positive associations are shown in red [odds ratio (OR) >1] and negative associations (OR < 1) in blue, with the strength of the line color reflecting the magnitude of the effect. ORs (exp β) (see table S3) relative to uninfected individuals, with 95% confidence intervals in brackets. Thus an individual with a new B. microti infection is ~5 times as likely to become infected with A. phagocytophilum than an uninfected individual (OR = 5.43). Infection history associated with each effect is also indicated: N, negative, P, positive. Thus, NP indicates no infection at t−1, infection at t0. −P is used to signify that NP and PP show similar effects. Because B. microti induces a chronic infection, there are three infection status histories (uninfected, chronic, and new infections). For cowpox virus, a probability of infection was used in analyses, and results are for individuals that sero-converted at t0 (i.e., NP infection history, probability of infection at t0 = 0.5) (12).

