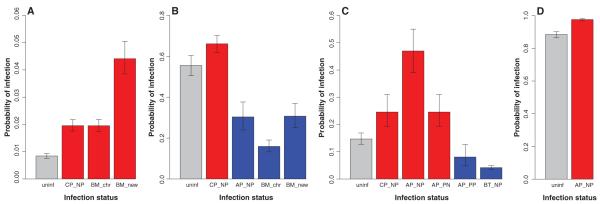
Fig. 2.
Predicted probabilities of acquiring an infection depending on infection status by other parasites for (A) A. phagocytophilum (AP), (B) Bartonella spp. (BT), (C) B. microti (BM), and (D) cowpox virus (CP). Predictions are based on the models in table S3. Gray bars represent individuals without other infections (uninf); red and blue bars highlight positive and negative effects on susceptibility, respectively. Each bar is labeled with the infection (e.g., CP) and the infection history (see Fig. 1 for explanations) associated with each effect. Error bars represent 95% confidence intervals, averaged over random effects. Predicted probabilities are defined with reference to an 18-g male in July at one specific site. In cases where NP and PP show similar effects, predicted probabilities are based on an NP infection history.

