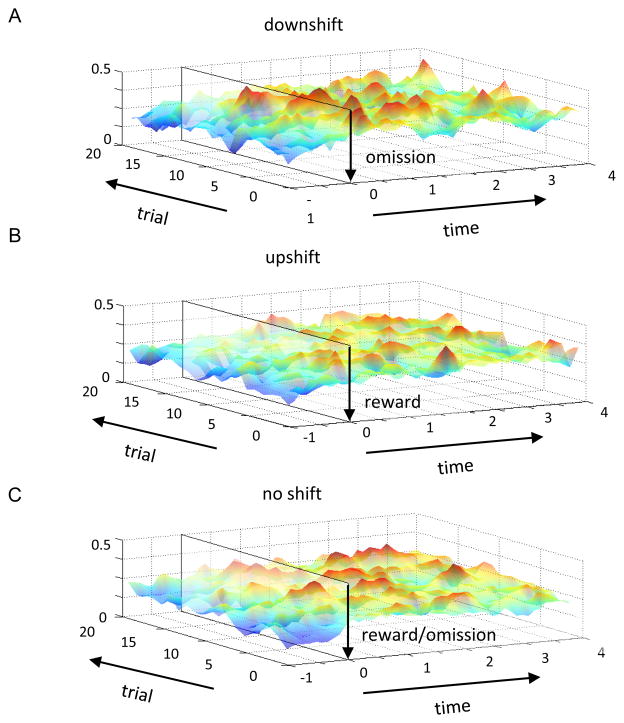
Figure 3.
A. Population heat plot representing neural activity in CeA omission-responsive neurons at the time of reward omission (2lo / 4sm). Average activity is shown for the first and last 10 trials in these two blocks. Activity is shown, aligned on reward omission, which is 500 ms after well entry in the 2lo block and 1000 ms after well entry in the 4sm block. B. Population heat plot representing neural activity in CeA omission-responsive neurons at the time of reward delivery (2sh / 3bg / 4bg). Average activity is shown for the first and last 10 trials in these three blocks. Activity is shown, aligned on reward delivery, which is 500 ms after well entry in the 2sh block and 1000 ms after well entry in the 3bg and 4bg blocks. C. Population heat plot representing neural activity in CeA omission-responsive neurons during blocks in which there was no overt shift in reward value (1sh / 1lo / 3sm). Average activity is shown for the first and last 10 trials in these three blocks. Activity is shown, aligned on reward delivery or omission, which is 500 ms after well entry in the 1sh and 1lo blocks and 1000 ms after well entry in the 3sm block. For activity in the omission responsive population aligned on cue and reward delivery across the entire task, see figure S1A. For activity in a CeA reward responsive population, see figure S1B.

