
Fig.6. Effect of TF-2 on the expression of inflammatory genes in vivo.
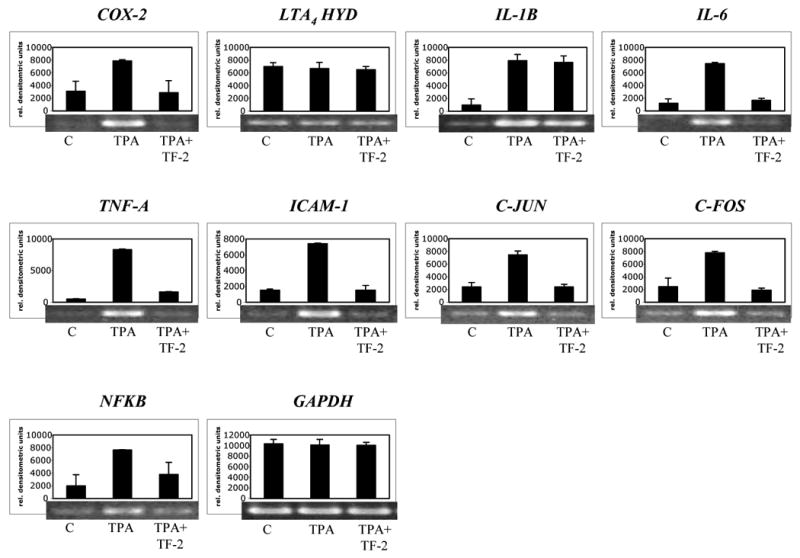
Mouse skin was treated by topical application of TPA (6 nmol) or by TPA and TF-2 (6 μM) for 5 h. Acetone as carrier served as control. Thereafter, gene expression of COX-2, LTA4 HYD, IL-1B, IL-6, TNF-A, ICAM-1, C-JUN, C-FOS, and NFKB was analyzed by RT-PCR using GAPDH as internal standard. Level of gene expression was quantified using densitometry and expressed as relative densitometric units. Mean values + standard deviation of two independent experiments are shown in the histograms. Representative blots are shown below the histograms.