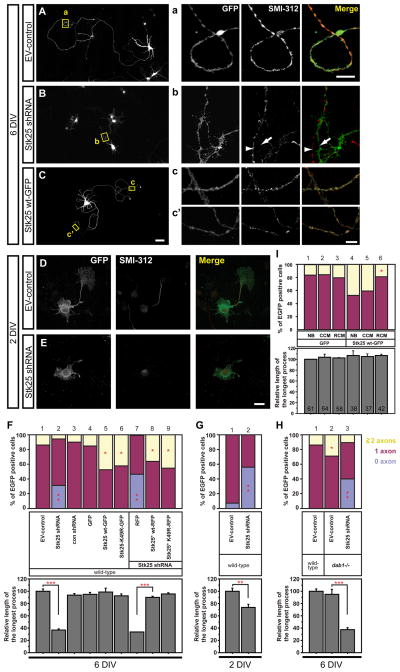
Figure 1. Stk25 expression regulates axon differentiation in culture.
A Primary hippocampal neurons (E17.5) infected with the GFP-expressing EV-control virus had typical pyramidal neuron morphologies, including a long SMI-positive axon (inset a) and shorter dendrites. B Neurons infected with the Stk25 shRNA virus had shorter processes and frequently lacked long (>250 μm) SMI-positive processes that meet the criteria for axons (inset b). An SMI-positive process (arrowhead) from a non-infected neuron runs parallel to the GFP-positive process (arrow). C Cells overexpressing Stk25 wild-type (wt)-GFP had multiple SMI-positive axons (insets c, c’). D At stage III (2DIV), EV-control infected neurons have one dominant SMI-positive axon. E In contrast, Stk25 shRNA-expressing neurons often lacked SMI-positive, axon-like processes. F The number of neurons with 0, 1, 2 or more axons and the length of the longest processes were determined for neurons infected with the indicated viruses. For rescue experiments, neurons were coinfected with the Stk25 shRNA (GFP positive) and either RFP, Stk25* wt-RFP, or Stk25* K49R-RFP expressing viruses (lanes 7-9, Fig. S2). G At stage III (2DIV) many Stk25 shRNA-expressing neurons lacked axons as compared to a small percentage of EV-control infected neurons H The number of neurons with multiple axons was increased in dab1 −/− (lane 2) compared to wild-type neurons (lane 1, duplicated from F) and this was reduced by Stk25 shRNA expression (lanes 3). I Primary hippocampal neurons that were infected with either GFP or Stk25 wt-GFP expressing viruses were split into three groups and grown in either neurobasal (NB), control-conditioned (CCM) or Reelin-conditioned (RCM) media for six days. Statistical significance (*,**,***, p <0.0001, Student’s t-test, compared between the sample pairs: for F 1:2; 4:5,6,7; 7:8,9, for G 1:2, for H 1:2, 2:3; n >60; I 5:6 n indicated in bars). Bars C 50 μm; a, c’ 5 μm; E 20 μm. See also Fig. S1.

