
Figure 4. Suppressed fatty acid oxidation and oxidative metabolism in SMRTmRID1 mice.
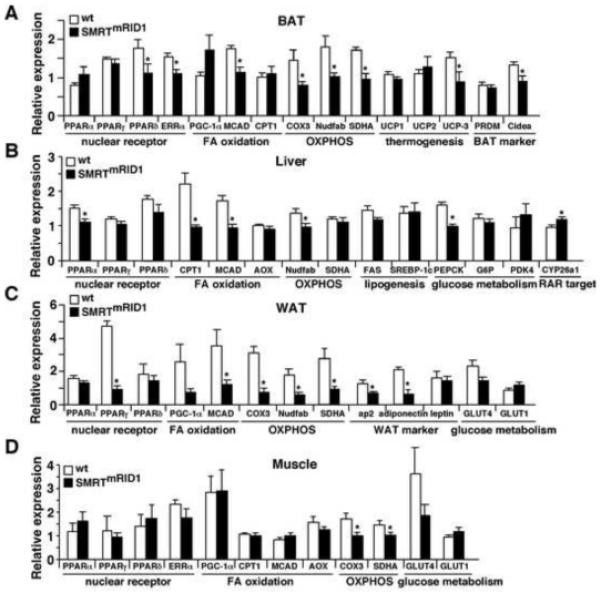
(A) to (D) gene expression profiling by real-time PCR of brown adipose tissue (BAT), liver, white adipose tissue (WAT) and muscle from wt and SMRTmRID1 female mice on normal chow (6-month old, n=6/genotype) after 5 hr fasting. OXPHOS: oxidative phosphorylation. Values are expressed as means±SEM. *p<0.05, comparing wt to SMRTmRID1 mice.