
Figure 6. SMRTmRID1 inhibits mitochondrial function.
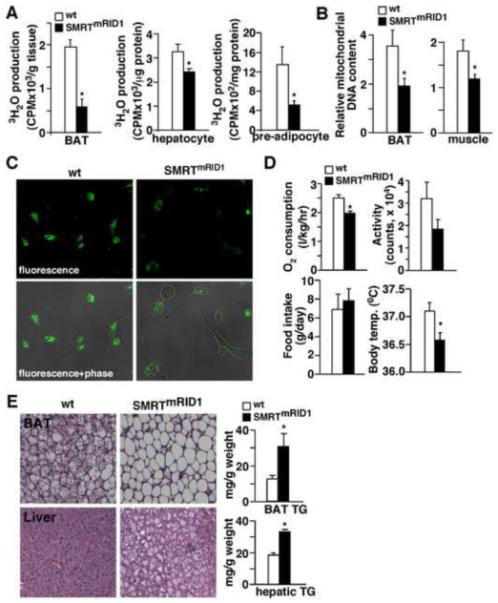
(A) Assessment of fatty acid β-oxidation in brown fat (BAT) organ culture, primary hepatocytes and pre-adipocytes/fibroblasts. The rate of fatty acid oxidation was determined by 3H-palmitate breakdown to 3H2O. (B) Assessment of mitochondrial DNA content in BAT and muscle. Mitochondrial DNA was quantified by real-time PCR and normalized to nuclear DNA content. (C) SMRTmRID1 MEFs have reduced mitochondrial content. MitoTracker staining (green fluorescence) was conducted to determine mitochondrial content. (D) SMRTmRID1 mice show reduced O2 consumption and lowered body temperature. O2 consumption, activity and food intake were determined by metabolic cages. (E) Histological analyses of BAT and liver sections (H & E staining) to examine lipid accumulation (see also Figure S3). Tissue triglyceride (TG) content was measured by enzymatic assays. Muscle, BAT and pre-adipocytes were isolated from 6-month old mice. Primary hepatocytes were from 2.5-month old mice. Values are expressed as means±SEM. *p<0.05, comparing wt to SMRTmRID1 mice/cells.