
Figure 7. Increased susceptibility to oxidative damage and premature senescence in SMRTmRID1 cells.
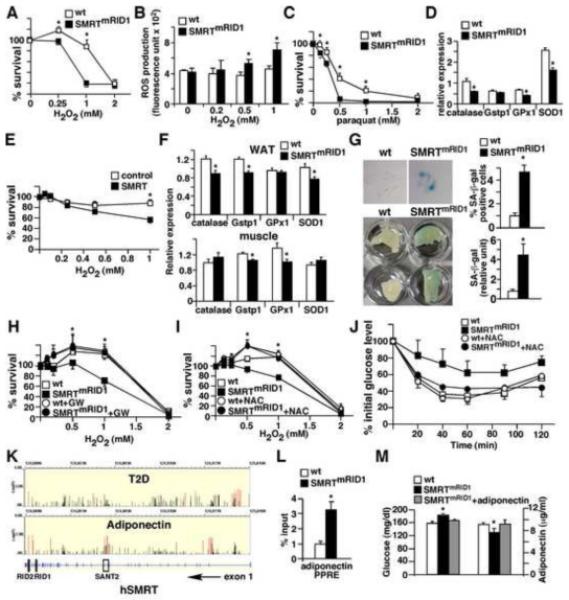
(A) Increased susceptibility to oxidative stress in SMRTmRID1 primary MEFs. Wt and SMRTmRID1 MEFs were treated with H2O2 to induce oxidative stress and cell survival was determined 24 hr later. (B) Elevated ROS production in SMRTmRID1 MEFs determined by CM-H2DCFDA. (C) SMRTmRID1 MEFs exhibit reduced survival upon paraquat treatment. (D) Down-regulation of anti-oxidant genes in SMRTmRID1 MEFs determined by real-time PCR. (E) SMRT over-expression reduces stress resistance in HepG2 cells. HepG2 cells were transfected with either the empty vector (control) or SMRT expression vector to achieve a 2-fold increase in SMRT mRNA levels (see Figure S4A). H2O2 treatment started 24 hr after transfection. (F) Reduced tissue expression of genes encoding anti-oxidant defense mechanism in SMRTmRID1 mice determined by real-time PCR. (G) SMRTmRID1 cells show premature senescence. Top panel: Wt and SMRTmRID1 MEFs at passage 12 were stained with X-gal to examine senescence-associated β-galactosidase (SA-β-gal) activity (blue cells). Bottom panel: SA-β-gal activity in white adipose tissues from 6-month old mice. The blue staining in tissue lysate was quantified and normalized to protein concentration. (H) PPARδ activation rescues the phenotype of oxidative stress response in SMRTmRID1 cells. PPARδ ligand pre-treatment (0.1 μM GW501516 for 60 hours) increased the survival of SMRTmRID1 cells. (I) Anti-oxidant pre-treatment normalizes the stress resistance of SMRTmRID1 MEFs. Cells were treated with 0.5 mM N-acetylcystein (NAC, an anti-oxidant) 1 hr before H2O2 treatment. (J) Insulin tolerance test showing NAC treatment reverts the reduced insulin response in SMRTmRID1 mice. NAC (10 mg/ml) was giving in drinking water for one week. The difference between wt and SMRTmRID1 mice (n=5/genotype, 6-8 month old females) for each time point without NAC treatment was statistically significant (not significant after treatment). (K) The associations of SNPs in human SMRT (N-COR2) gene with the risk of type 2 diabetes (T2D) and plasma high molecular weight (HMW) adiponectin concentration, annotated with the gene structure (bottom panel, exons are shown). The y axis represents −log(P value) from the logistic regression (T2D) and linear regression (HMW adiponectin) analyses. All identified SNPs are shown. The red lines represent the associations of nominal significance (P value <0.05, see also Table S1). (L) ChIP showing increased SMRT binding on the PPRE of adiponectin promoter in SMRTmRID1 adipocytes. Primary adipocytes were isolated from 2-month old mice. IgG ChIP or 10kb upstream negative controls showed no specific bindings (data not shown). (M) Adiponectin administration normalizes the glucose level in SMRTmRID1 mice. Tail vein injection of 10 μg recombinant adiponectin in SMRTmRID1 mice increased the serum adiponectin level similar to that in wt mice (shown on the right), which normalized the blood glucose concentration (shown on the left). Values are expressed as means±SEM. *p<0.05, comparing wt to SMRTmRID1 mice/cells.