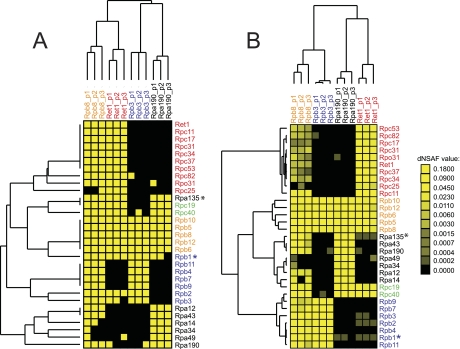
Fig. 2.
Binary and Quantitative Clustering. A, Cluster analysis of the binary values (0 = absent (black), 1 = present (yellow) for RNA polymerase subunit detection by MudPIT analysis. B, Cluster analysis of the dNSAF values from each RNA polymerase preparation to determine the relatedness of the different purifications. The yellow color intensity is indicative of the dNSAF value according to the scale shown to the right of B. For both figures, the dendrogram at the top of the cluster represents the relationship between the baits whereas the dendrogram to the left represents the relationship between the purified proteins (preys).

