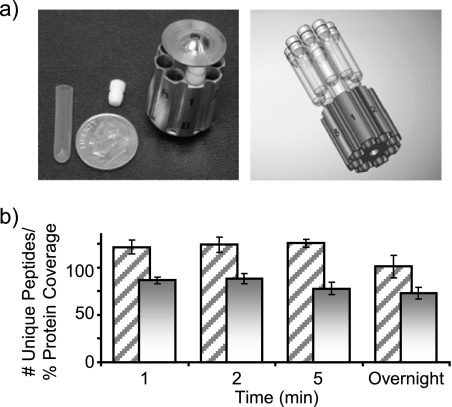
Fig. 1.
a, the left panel shows a photograph of the MicroTube insert, and MicroTube holder used for off-line pressure digestion experiments with a dime for size comparison. The right panel shows how MicroTubes are inserted into the holder. b, the histogram depicts the average number of unique identified peptides and average protein coverage obtained from two duplicate LC-MS/MS runs of bovine serum albumin digested with pepsin for three different lengths of time at 25,000 p.s.i. and an overnight digestion at 37 °C and ambient pressure. The percentage of protein coverage is depicted as a solid bar, and uniquely identified peptides are depicted as diagonal lines. Error bars represent one standard deviation.

