Fig. 2.
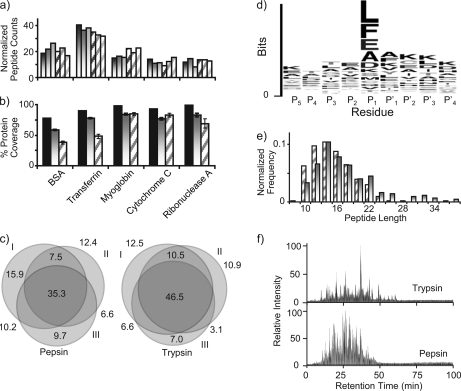
Comparison of enzyme performance for pepsin and trypsin pressure-assisted digestions using a five-standard protein mixture consisting of BSA, transferrin, myoglobin, cytochrome c, and ribonuclease A. a and b, histograms comparing normalized peptide counts and percentage of protein coverage for three technical replicates of pressurized digestions using either trypsin (shaded gradation bars) or pepsin (diagonal striped bars) for 1 min. Solid black bars indicate the total unique protein coverage when data from both digestions were combined. c, Venn diagrams showing the peptide overlap between three technical digestion replicates (I–III), including the percentage of identified peptides in each region. d, sequence logo for the amino acid sequence motif of pepsin-generated peptides identified by MS/MS analysis. e, histogram depicting the frequency of peptide length identified from the peptides identified either by trypsin (shaded gradation bars) or pepsin (diagonal striped bars). f, representative chromatograms corresponding to the LC-MS/MS of a pressure-assisted digestion for trypsin (top) and pepsin (bottom).

