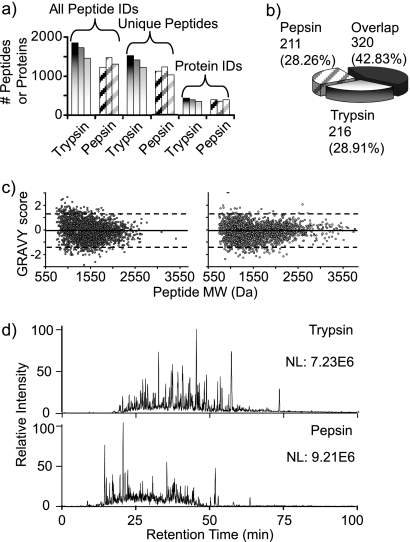
Fig. 3.
Comparison of enzyme performance and peptide properties for pepsin and trypsin pressure-assisted digestions using S. oneidensis protein extract as model proteome. a, histograms comparing the performance of 1-min pressure-assisted digestion with trypsin (shaded gradation bars) and pepsin (diagonal striped bars) across three technical replicates. b, pie chart representing the overlap of enzyme exclusive peptide identifications. c, GRAVY values plotted against the calculated molecular masses for the identified peptic (left) and tryptic (right) peptides. d, representative chromatograms corresponding to the LC-MS/MS of pressure-assisted digestion for trypsin (top) and pepsin (bottom) after a 2-min digestion.

