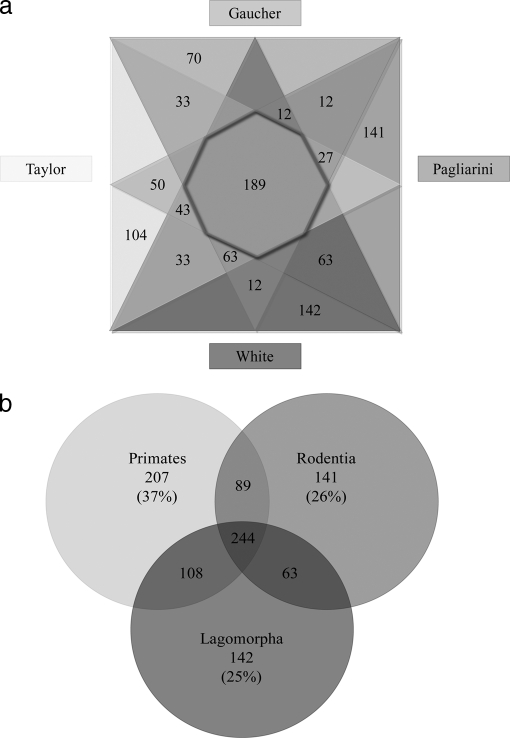
Fig. 2.
Direct comparison of mitochondrial protein identifications across four investigations. To illustrate the overlap and unique identifications from the current study and those undertaken in species with complete genome annotation we produced a four-way Venn diagram, comparing the individual studies (a) and a 3-way Venn diagram to illustrate the species to species variation (b). Fig. 2a shows the current study; and those undertaken by Gaucher et al. (22); Pagliarini et al. (20) and Taylor et al. (21). A total of 188 proteins were identified with across all investigations (as indicated by the intersection of the four triangles). The current study indentified 142 proteins, the study by Pagliarini et al. showed 141 unique proteins, whereas Taylor et al. and Gaucher et al. observed 104 and 70 unique proteins respectively. Overlapping segments of the triangles, represent the proteins shared between studies. Fig. 2b shows the comparison between primates (21, 22), rodents (20); and Lagomorpha. In this species comparison, 244 protein groups (25%) were identified across all investigations. Each species identified a unique subset of protein groups, which were compared with the total number of proteins identified within that species to give the percentages presented.

