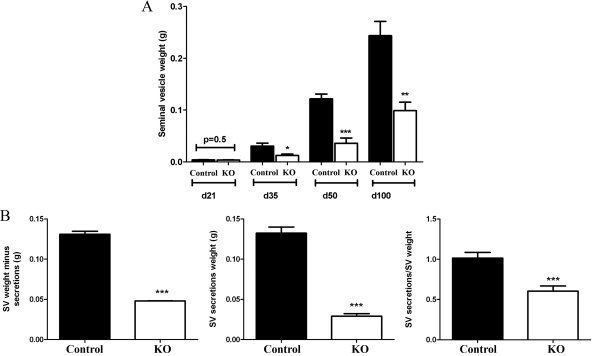
Figure 2.
Gross morphology of PTM-ARKO seminal vesicles. A, Quantification of SV weight in PTM-ARKO mice at d 21–100 showing that there is a significant reduction at d 35 onward but not at d 21. B, Quantification of empty SV minus secretion and SV secretion weight as well as secretion weight relative to SV weight in PTM-ARKO mice at d 100. Values are means ± sem (n = 6–14 mice). *, P < 0.05, **, P < 0.01, ***, P < 0.001, compared with age-matched controls.

