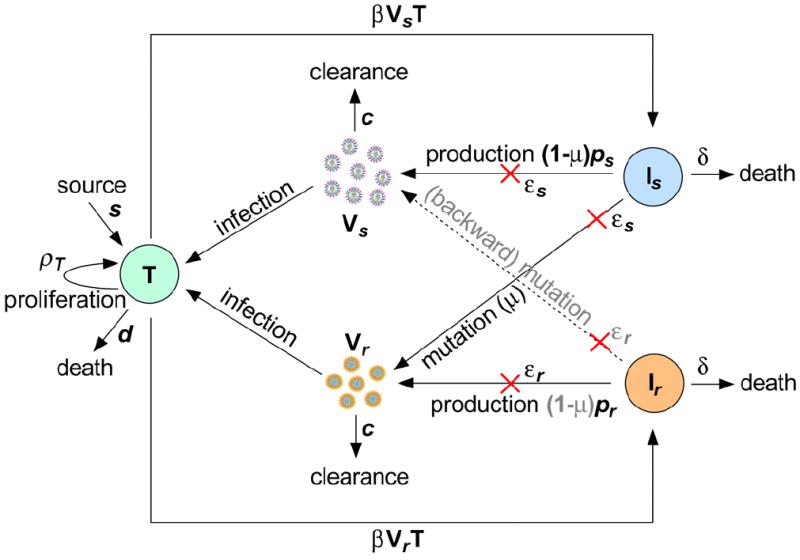
Figure 1.

Schematic representation of the viral dynamic model. There are five variables: target cells (T), drug-sensitive virus (Vs), drug-resistant virus (Vr), cells infected with drug-sensitive virus (Is), and cells infected with resistant virus (Ir). s, ρT and d are the recruitment rate, maximum proliferation rate and death rate of target cells, respectively; β is the infection rate of target cells by virus; δ is the death rate of infected cells; and ps and pr are the viral production rates of the two strains; εs and εr are the drug efficacies of telaprevir in reducing viral production; μ is the mutation rate from the drug-sensitive to drug-resistant strain; and c is the viral clearance rate. The red crosses represent the effect of treatment in blocking viral production.
