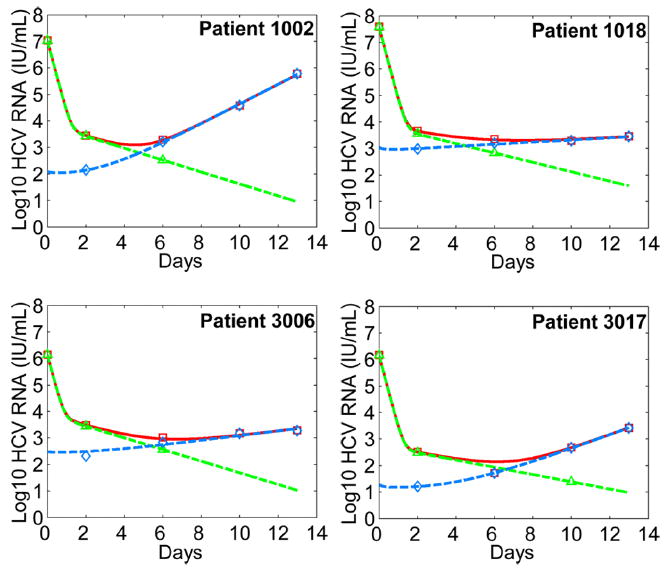
Figure 3.

Comparison between model predictions and patient data during telaprevir monotherapy. We employed the pretreatment steady-state values (14) as the initial conditions of the model. We fitted Vs (green dashed) and Vr (blue dashed) in Eq. (1) to the drug-sensitive (green triangle) and drug-resistant (blue diamond) viral load data simultaneously, where Vr is the sum of viral loads of all drug-resistant strains. Since we ignored the drug-sensitive viral load data when they were below the detection limit of the sequencing assay (< 5%) (11), we included fitting Vs + Vr (red solid) to the total viral load data (red square). The best-fit parameter values for each patient are listed in Table 2. Note here day 0 is the time of initiation of telaprevir therapy, whereas in the original study telaprevir therapy was started at day 2 (11, 12).
