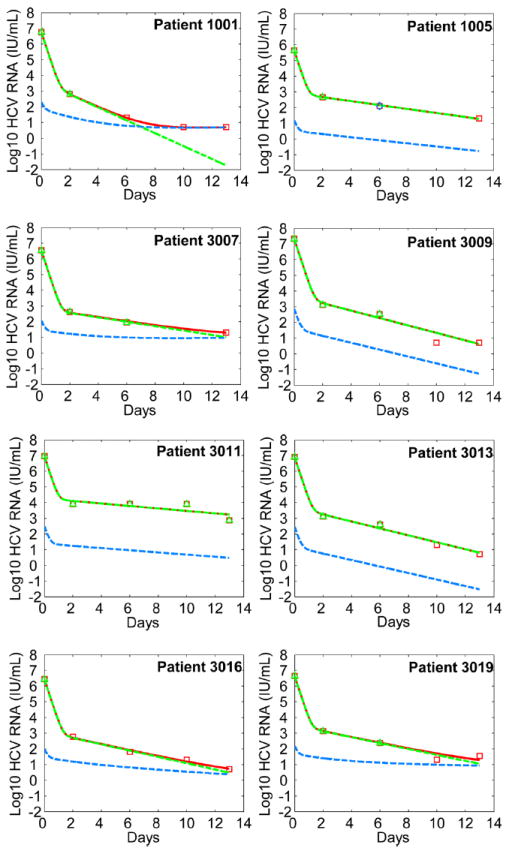
Figure 4.

Comparison between model predictions and patient data during combination therapy. We fitted the model Eq. (S1) in (14)] to the viral load data from patients receiving both PEG-IFN-α-2a and telaprevir for 14 days. This model generalizes Eq. (1) by incorporating an effect of IFN in partially blocking viral production. The fitting procedure and the symbols used are the same as those in Fig. 3. The best-fit parameter values for each patient are listed in Table 3. Note that the two fits of the drug-sensitive (green dashed) and total viral load (red solid) overlap in a few patients.
