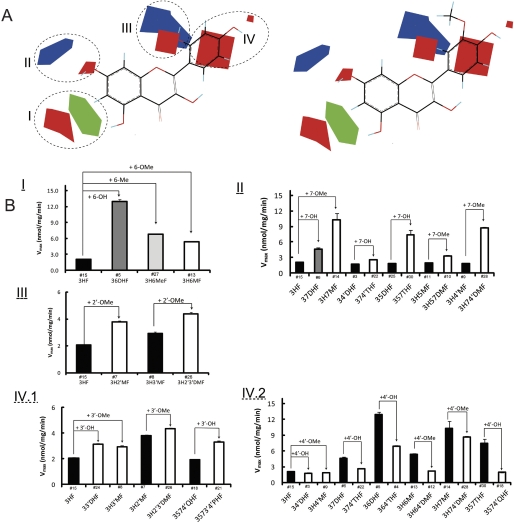
Fig. 8.
A, steric and electrostatic maps from the UGT1A9 CoMFA model of Vmax. Morin (compound 19; left) and isorhamnetin (compound 17; right) are shown inside the field for reference. Green indicates areas in which bulky groups are sterically favorable for glucuronidation. Blue indicates areas in which electropositive atoms are favorable for glucuronidation. Red indicates areas in which electronegative atoms are favorable for glucuronidation. B, matching of the CoMFA to experimental data. I, bulky groups at C6 increased Vmax values. II, 7-OH or 7-OMe increased Vmax values. III, 2′-OMe increased Vmax values. IV1, 3-OH or 3-OMe increased Vmax values. IV2, 4-OH or 4-OMe decreased Vmax values. The compound numbers are labeled above the abbreviated chemical names.

