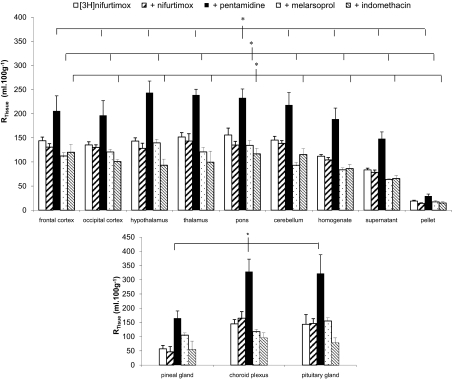
Fig. 7.
The [14C]sucrose-corrected CNS distribution of [3H]nifurtimox in the absence and presence of 6 μM nifurtimox, 30 μM melarsoprol, 10 μM pentamidine, and 10 μM indomethacin (DMSO present). Each group shows n = 4–5. The overall difference in the different experimental group is greater than would be expected by chance after allowing for effects of differences in region (*, P ≤ 0.001; two-way ANOVA). Tukey's test on these groups revealed a significant difference between each individual experimental group with [3H]nifurtimox alone (each unlabeled drug group compared with the [3H]nifurtimox-alone group; P < 0.001). Data are not shown for caudate putamen and hippocampus.

