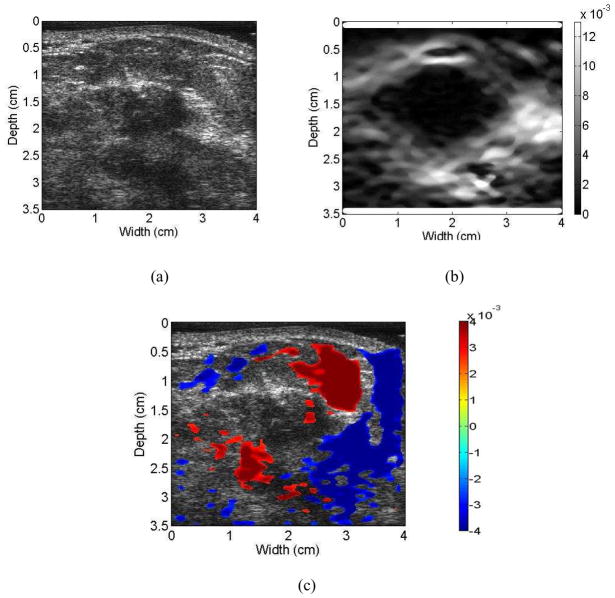
Figure 3.
Ultrasound B-mode (a) image for a patient diagnosed with an invasive ductal carcinoma along with the corresponding axial strain (b), and the axial-shear strain image patterns superimposed on the B-mode image forming a composite image (c). Note that the NASSA value for this patient was 1.64. The colorbar range is the same for all the axial strain and shear strain images, respectively where a 1% strain is depicted as a 0.01 level.

