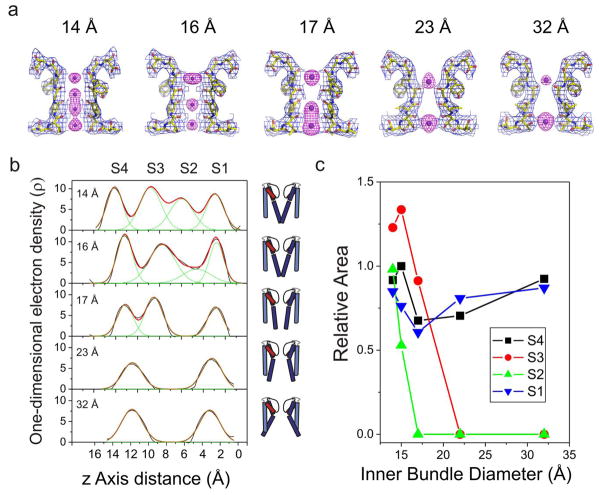
Figure 4.
Correlation between inner gate opening and selectivity filter ion occupancy. a. Electron density maps for the different K+ ion occupancies at the selectivity filter and various degrees of inner bundle gate opening (measured as Cα-Cα distances at T112, top numbers). Shown, in each case, are the composite omit maps (blue mesh contoured at 2σ) of the filter corresponding to residues 74–80 from two diagonally symmetric subunits and the Fo−Fc omit map (magenta mesh contoured at 4–6σ) corresponding to ions in the filter. b. Individual one-dimensional electron density profiles along the axis of symmetry (Z-axis) for each of the distinct occupancy models, shown using Gly79-Cα as Z=0. S1, S2, S3 and S4 represent the binding sites of K+ ions in the selectivity filter. The cartoon channels represent the relative degree of opening in the inner bundle gate for each density profile. c. The dependence of the relative ion occupancies for each of the four K+ binding sites (S1–S4) with the degree of opening in the inner bundle gate.

