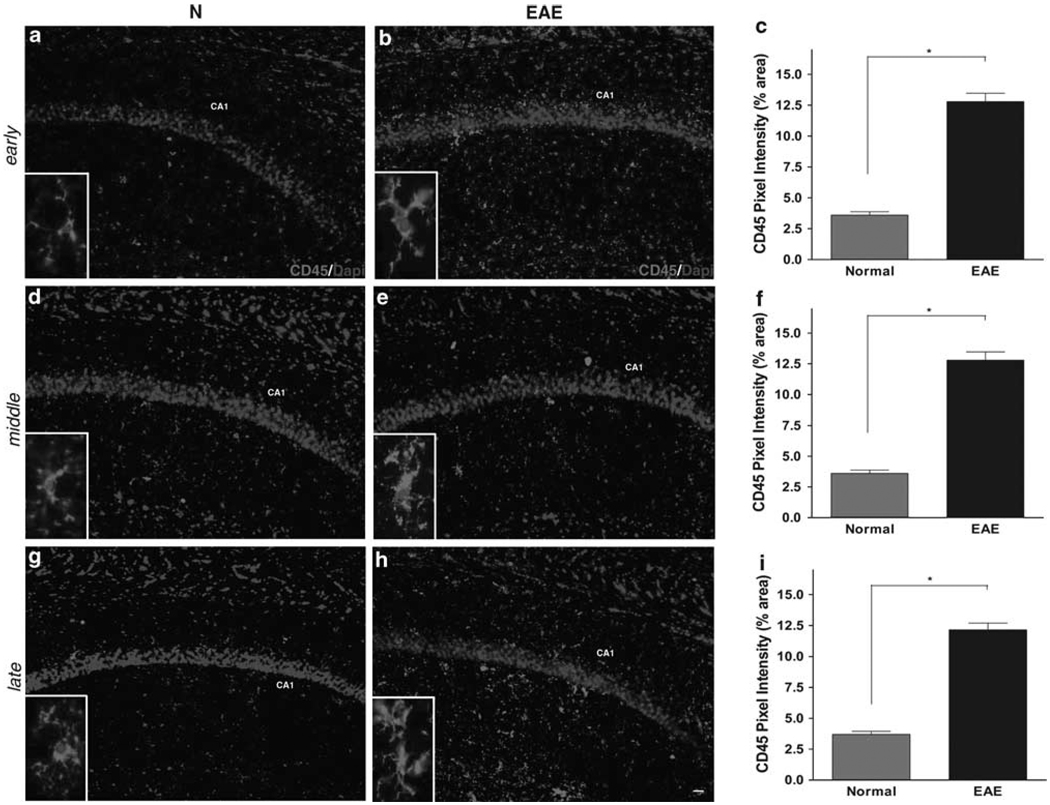
Figure 3.
Inflammation in the hippocampal CA1 region during experimental autoimmune encephalomyelitis (EAE). Microglial activation, identified by CD45+ labeling (Cy5-red), was measured in dorsal CA1 of early-, middle- and late-stage EAE mice, and compared with healthy age-matched normal mice. Normal mice and EAE mice are denoted by N and EAE. At all time points, EAE mice had significantly more CD45+ labeling than normal mice. CA1 seen by DAPI+ labeling (blue) of pyramidal cell layer. Images were taken at × 10 magnification, with small insets of normal and activated microglia, taken at × 40 magnification. Microglia in EAE have ramified morphology, indicative of inflammatory activation. Quantification of CD45+ pixel intensity (% area of immunoreactivity) shown in graphs c, f and i, with *indicating statistical significance, P<0.0001; n = 8 per condition, per time point. Scale bar, 20 µm.

