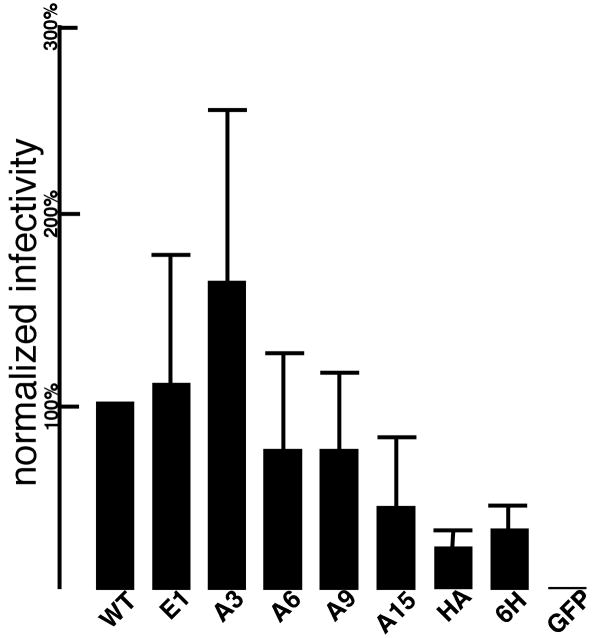
Figure 7. Virus infectivity.
Viruses were produced by transfection of 293T cells with the indicated pXM-GPE constructs, plus the VSV glycoprotein expression construct (pVSV-G), and the β-gal retroviral vector expression construct, B2-BAG. Viruses were collected and filtered, and used to infect Rat1 cells as described in the Materials and Methods section. Raw infectivity values were derived from β-gal activity levels in infected target cells, normalized to virus CA input levels to obtain CA-normalized infection levels. The CA-normalized levels then were normalized to WT infection levels determined in parallel at the same time. Values are shown as percentages of WT infectivity and derive from the following numbers of independent experiments: E1, 4; A3, 3; A6, 4; A9, 4; A15, 3; HA, 4; 6H, 3; GFP, 2.

