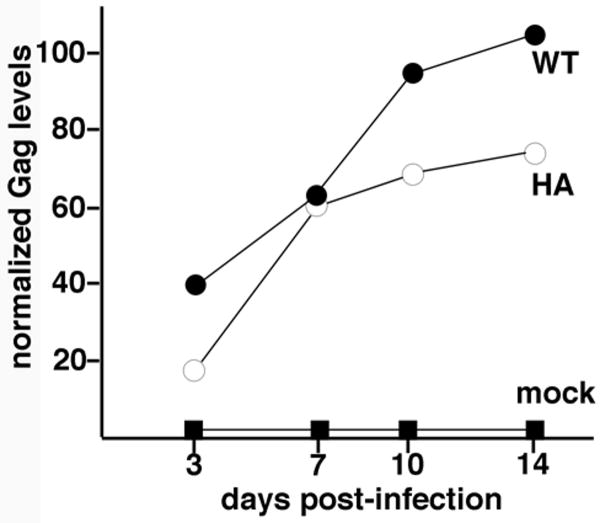
Figure 8. Analysis of replication kinetics.
Rat1 cells were mock-infected (mock), or infected with WT or HA viruses, after which virus replication was tracked by measuring Gag (PrGag + CA) protein levels in infected cells for two weeks post-infection. Input virus levels were equivalent based on Gag protein levels, and Gag protein levels in the chart were normalized to the WT fourteen day Gag protein level.

