
Figure 4.
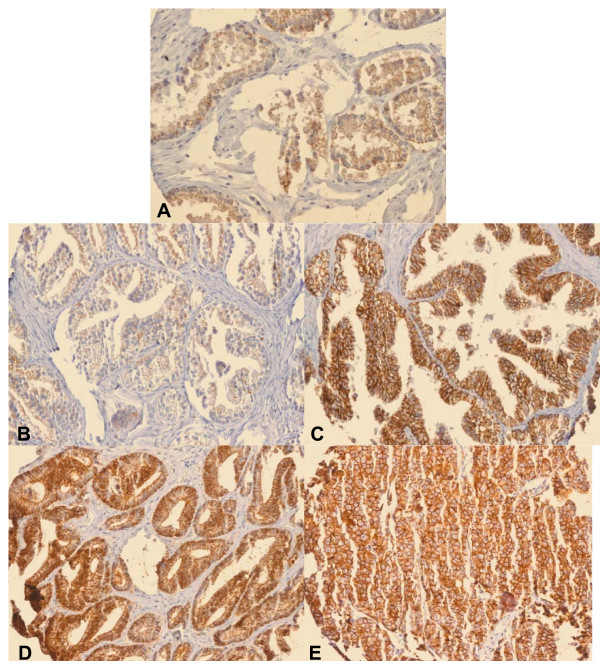
Photomicrographs of TMA cores. Photomicrographs of TMA cores (20x). A) NAC, B) BPH, C) PIN, D) PCA, and E) Mets. Average staining was higher in PCa and Mets than in NAC and BPH. The immunostain was predominantly membranous in positive cases, however cytoplasmic staining was additionally noted in select cores as depicted most prominently here in the photomicrographs of PCa and Mets.