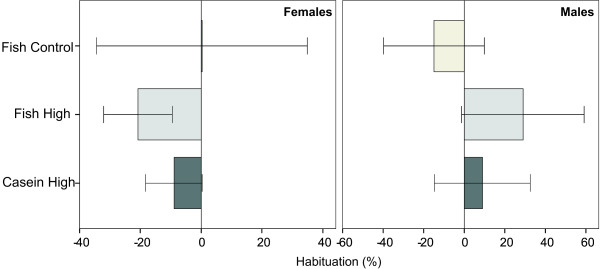
Figure 5.
Habituation to the acoustic startle stimuli in week 16. Reduction in startle response at the end compared to at the start of the trial. The bars and the error bars represent the percent habituation (mean ± SEM). A negative value indicates a normal habituation response, with a lower startle response at the end than at the start of the trial. Sample sizes were (females/males): Fish Control: n = 3/3; Fish High: n = 4/5; Casein high, n = 6/4.

