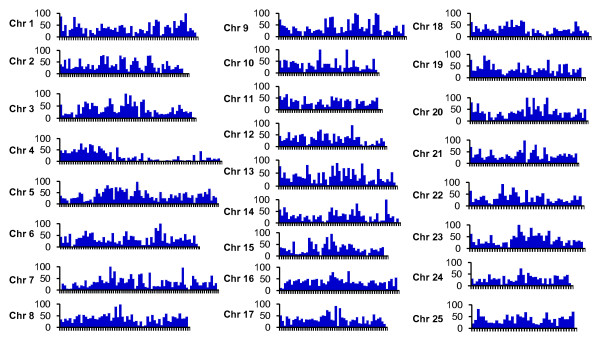
Figure 3.
Comparative analysis of the genes containing SNPs on 25 chromosomes of the zebrafish genome. Each of the 25 zebrafish chromosomes was laid out in the X-axis with one million base pairs intervals, and the number of genes contained with filtered SNPs residing in the interval was plotted on the Y-axis.

