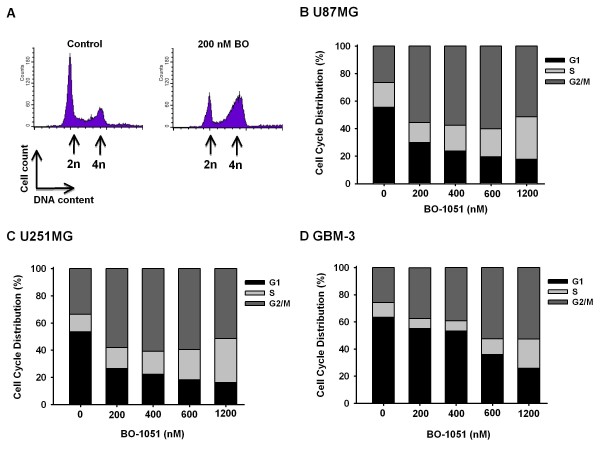
Figure 3.
Effect of BO-1051 on cell cycle profile in human glioma cells. Cultures were exposed to BO-1051 for 24 h before collection and FACS analysis of the propidium iodide-stained cells. (A) The DNA histograms depict cell cycle phase distributions of U87MG 24 h post-treatment. Cells in exponential growth were sham treated (left panel), treated with BO-1051 (200 nM, right panel) and then harvested 24 h later. (B-D) Cell cycle distributions of a panel of 3 human glioma cell lines (U87MG, U251MG and GBM-3) were exposed to the designated concentrations of BO-1051 for 24 h. Data displayed by the DNA content profiles were analyzed, and the cell cycle phase information is represented graphically.

