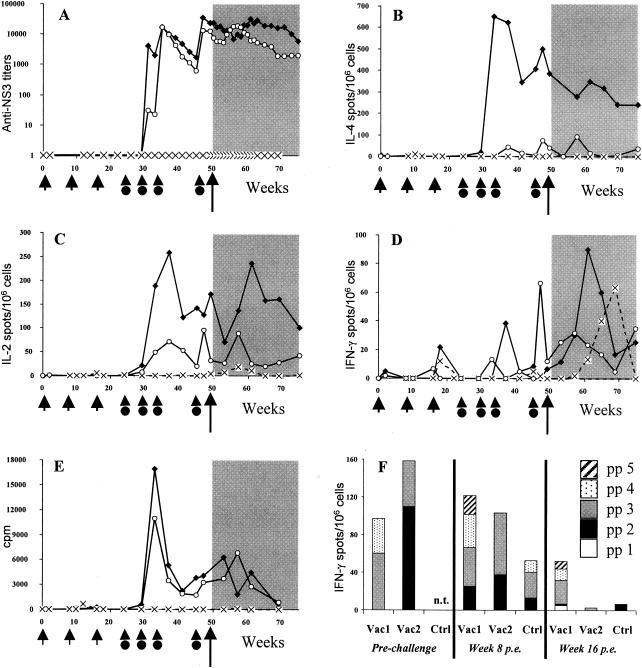
FIG. 4.
Kinetics of anti-NS3 immune responses elicited in Vac1 (▪), Vac2 (○), and the control animal (Ctrl) (×) by DNA priming and protein boosting (indicated by short arrows and arrowheads with circles, respectively) and after HCV challenge (long arrow, shaded area). Results for antibody titers (A), IL-4-producing cells (B), IL-2-producing cells (C), IFN-γ-producing cells (D), and lymphoproliferation assays (E) are displayed. (F) Results of IFN-γ ELISPOT assay with pools of 15-mer peptides covering the NS3 sequence (pp 1, aa 1028 to 1154; pp 2, aa 1148 to 1274; pp 3, aa 1268 to 1402; pp 4, aa 1395 to 1530; and pp 5, aa 1524 to 1659). Assays were performed prior to challenge (weeks 37 and 47 for Vac1 and week 47 for Vac2) and 8 and 16 weeks p.e. n.t., not tested.

