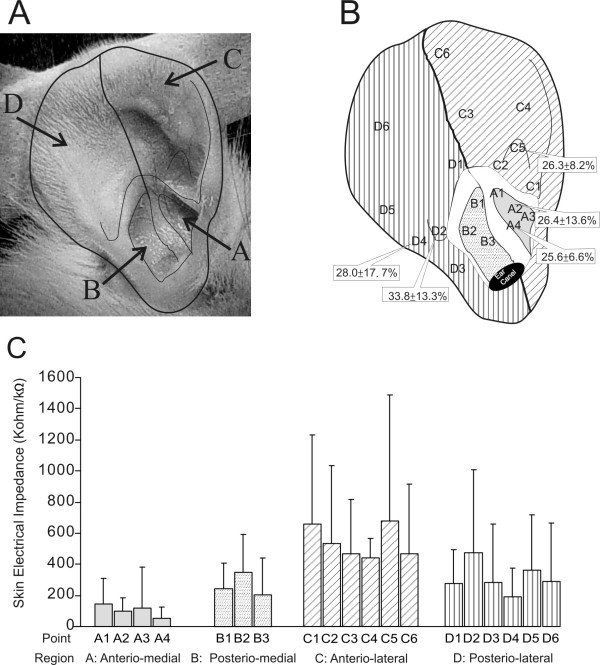
Figure 1.
Illustration of auricular acupoint identification. A: Photo of the rat right auricle, with lines indicating the anatomical landmarks. B: Drawing of the rat right auricle showing the location of points where electrical impedance was measured. The paw volumes after CA injection and electroacupuncture (0.7-1 mA, 4 Hz) at sites A2, A4, C5, D2 and D5 are shown in the respective boxes, and they are indicative of the anti-inflammatory efficacy of the given site. C: Histograms showing the electrical impedance obtained from the auricle (mean ± SD, n = 6).

