Figure 2.


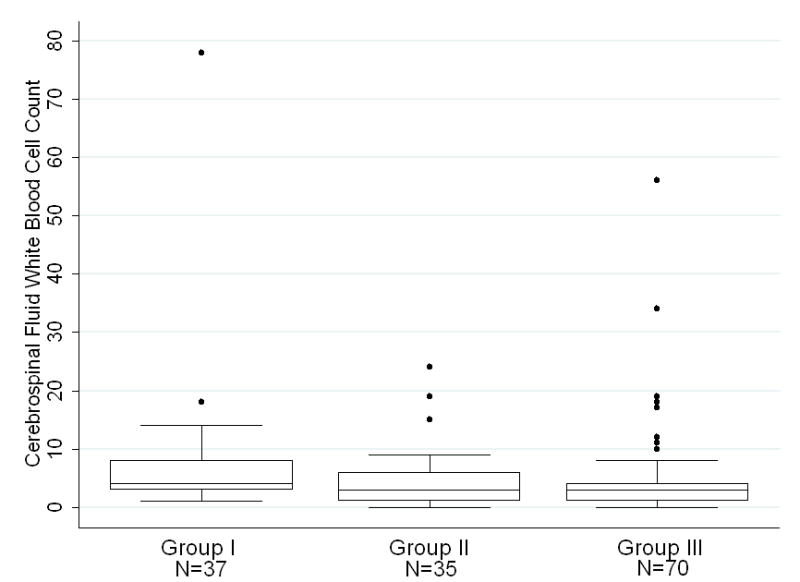
Figure 2a. Patients ages 0–28 days stratified by CSF EV PCR status and season. Group I represents neonates who tested negative for enterovirus by PCR during all seasons. Group II represents neonates who were not tested for enterovirus, during enterovirus season. Group III represents neonates who were not tested for enterovirus outside of enterovirus season. On each box plot, the box spans the interquartile range (IQR), the horizontal line through the box is the median value, and the whiskers denote outlying values, defined by convention as 1.5 IQRs lower than the first quartile and 1.5 IQRs higher than the third quartile. Dots represent individual patient values that fall beyond 1.5 IQRs. Data from two patients with CSF WBC values of 320/mm3 and 198/mm3 are not shown for clarity of presentation.
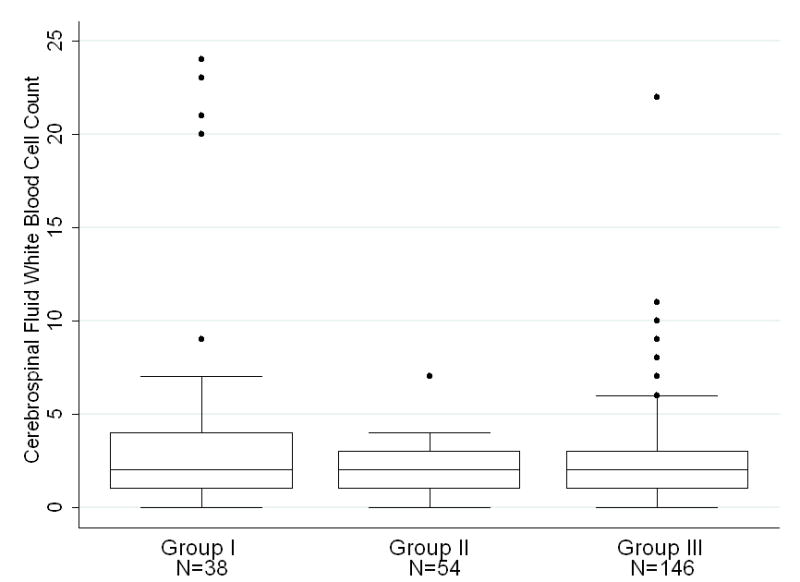
Figure 2b. Patients ages 29–56 days stratified by CSF EV PCR status and season. Group I represents infants who tested negative for enterovirus by PCR during all seasons. Group II represents infants who were not tested for enterovirus, during enterovirus season. Group III represents infants who were not tested for enterovirus outside of enterovirus season. On each box plot, the box spans the interquartile range (IQR), the horizontal line through the box is the median value, and the whiskers denote outlying values, defined by convention as 1.5 IQRs lower than the first quartile and 1.5 IQRs higher than the third quartile. Dots represent individual patient values that fall beyond 1.5 IQRs. Data from two patients with CSF WBC values of 34/mm3 and 43/mm3 are not shown for clarity of presentation.
