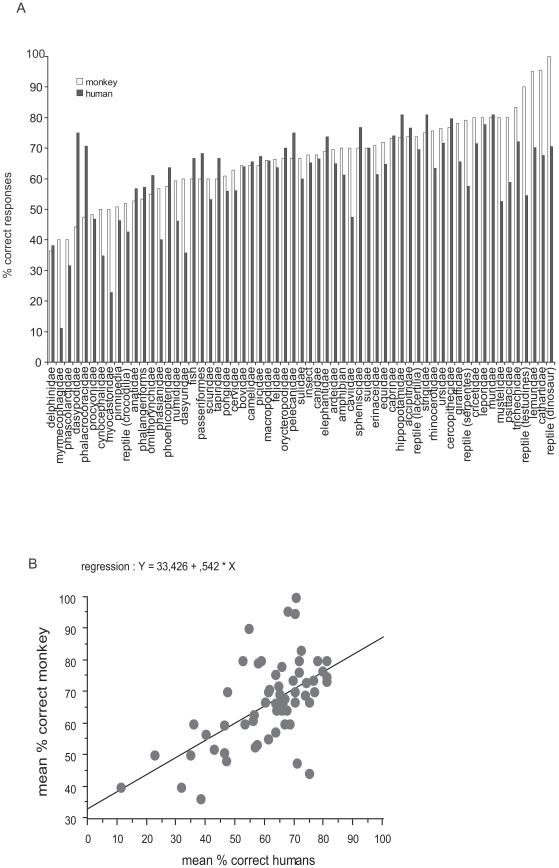
Figure 7. Responses to different animal families.
7a: bar plots of the respective percentage of correct responses for humans and for the monkey to different animal families. The number of stimuli contained in each family is very variable. 7b: mean percent correct responses of the monkey to different families of animals plotted against corresponding responses of human subjects. Also shown is the regression line.

