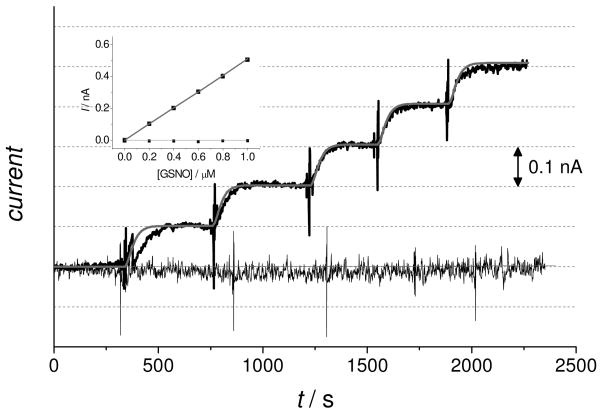
Figure 4.
Amperometric responses of an RSNO sensor at sub-micromolar concentrations of GSNO in PBS (pH 7.4) solution containing 50 μM GSH. The thick black curve shows the experimental data and the thick gray curve shows the simulated data in absence of oxygen. The thin black curve shows the experimental data and the thin gray curve shows the simulated data in presence of oxygen. The inset shows the calibration curve of the GSNO sensor, the color codes are the same as above.

