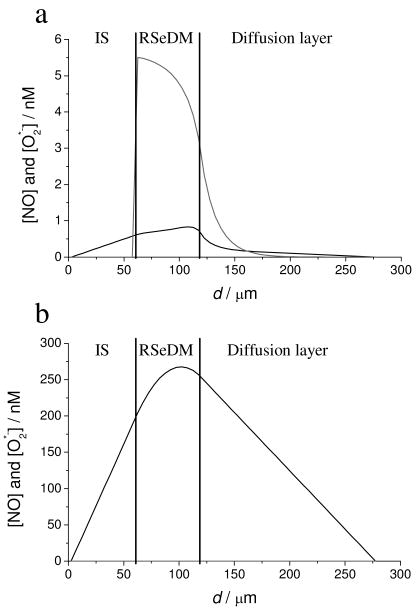
Figure 5.
Simulated steady-state concentration profiles of NO and in an RSNO sensor at a) 1 μM GSNO; b) 10 μM GSNO at varying distances from the surface of the platinum electrode in the amperometric RSNO sensor configuration. The black curve represents the NO concentration; the gray curve represents the concentration.

