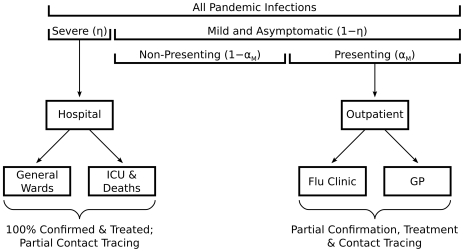
Figure 1. The severity and location of pandemic presentations.
Of all pandemic infections (calculated in the model through the SEIR dynamics) a proportion  are severe. Of the remainder,
  ), a proportion
  present to outpatient facilities. All severe cases present to hospitals for treatment; a fraction of these cases are admitted to intensive care units (ICUs). Mild cases present to general practices (GPs) and flu clinics for treatment and contact tracing. Effectiveness of antiviral interventions on the different groups accounts for setting-specific losses due to late presentation, testing delays and personnel constraints.

