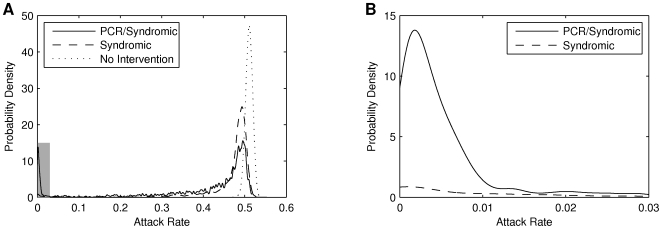
Figure 4. Probability densities of attack rate show the interventions have an “all or nothing” impact.
A: Kernel smoothing density estimates for  ( i. e. maximum severity). Both interventions shift the density leftwards, the expected attack rate now marginally less than without intervention. The PCR/Syndromic intervention shows a clear second peak at very low values for the attack rate. Few simulations result in an attack rate in the intervening space: the “all or nothing” impact. B: A magnified view of the shaded region in A, showing the second peak for the PCR/Syndromic strategy. The peak captures the simulations whereby antiviral distribution delayed the epidemic for sufficient time for the vaccine to be deployed and provide definitive control of the epidemic. It is noteworthy that almost all of the density under 10% (our and the AHMPPI 's working definition for successful mitigation) is in fact under 1%.

