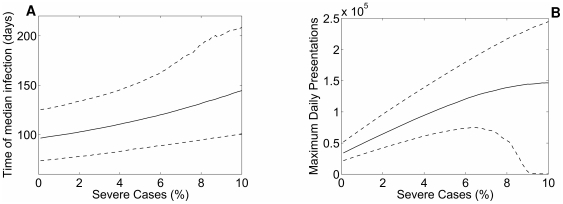
Figure 5. Timing and peak load of the epidemic as a function of the proportion of cases who are severe, under a PCR/Syndromic strategy.
A: Time to median infection (50% of the final attack rate), in relation to influenza severity under the antiviral intervention. The solid line reports the median value from 2,000 simulations, dashed lines represent 5 and 95
 centiles. As severity (and hence the presenting proportion) increases, more cases are amenable to intervention, resulting in delays in epidemic growth of several weeks. At low severity the variation in model outputs is due to LHS parameter sampling. The upward trend in the 5
 , 50
, 50 and 95
 centiles with increasing severity shows the impact of the intervention to slow transmission, even where definitive control is not achieved. The increased scatter of observed values at high severity assumptions (characterised by increased upward trend in the 95
 centile) reflects the ability of the vaccine to provide definitive control in a minority of simulations (see Figure 4). B: Maximum daily clinical presentations, in relation to influenza severity under the antiviral intervention. The solid line reports the median value from 2,000 simulations, dashed lines represent 5
 and 95
 centiles. Presenting cases necessarily increase with epidemic severity given the model's assumptions. However, when severity is high (9–10%) the 5
 centile values collapse to approach 0, denoting the successfully “mitigated” (due to vaccination) epidemics.

