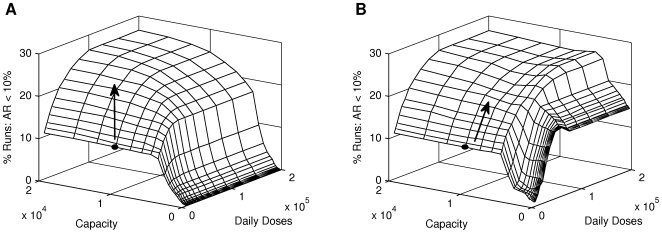
Figure 7. Impact of the PCR and PCR/Syndromic strategies, over a range of logistical constraints.
A: Impact of using PCR tests. B: Impact when switching to syndromic diagnosis once PCR diagnostic capacity is exceeded. For both figures, the proportion of simulations that are effectively controlled increases non-linearly with both diagnostic (PCR) capacity and the maximum daily antiviral prophylaxis delivery capacity. Black circles indicate estimates of current Australian constraints; arrows indicate the direction in which to increase these resources to optimally increase the impact.

