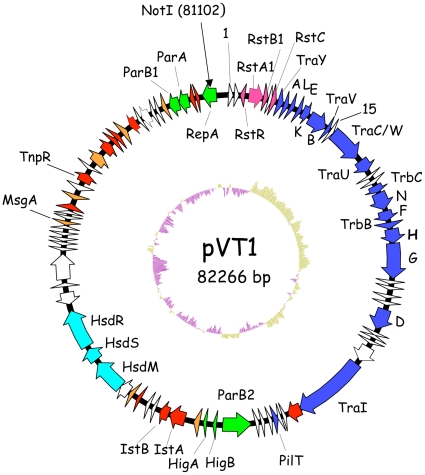
Figure 1. Genetic organisation of pVT1.
This diagram shows the circular genome of pVT1. ORFs are shown as arrows. ORFs involved in conjugation are filled in blue, ORFs from the defective phage RS1 in pink, ORFs involved in plasmid maintenance and replication are in green. The three ORFs corresponding to the Type I modification/restriction system are indicated in light blue. ORFs encoding transposases or remnants of transposases are filled in red. ORFs with some indication of functions (with the exception of transposases) are filled in orange. Other ORFs are not filled. The position of the unique NotI site is indicated. The deviation of the G+C content to the mean, calculated with a window of 500nt, is indicated in the inside track (in yellow, G+C> mean, in purple G+C content < mean.

