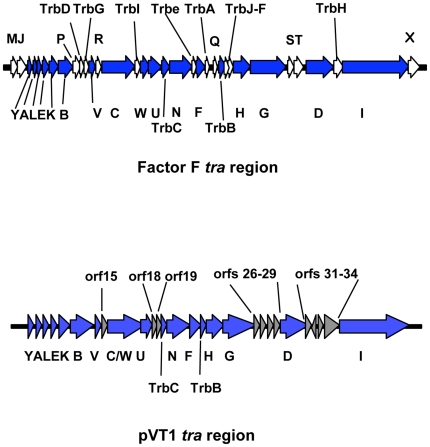
Figure 4. Comparison between the E. coli F factor and pVT1 tra regions.
Genes with function in conjugation and conserved between the two plasmids are indicated by arrows filled in blue. Genes specific to the F plasmid are filled in white. Names of genes are indicated (no prefix: tra genes). For the F factor, names of genes which are conserved between the two plasmids are underneath, whereas genes not conserved are above. In the case of pVT1, genes with no predicted functions in conjugation and no corresponding genes in the F factor are filled in grey and are listed above.

