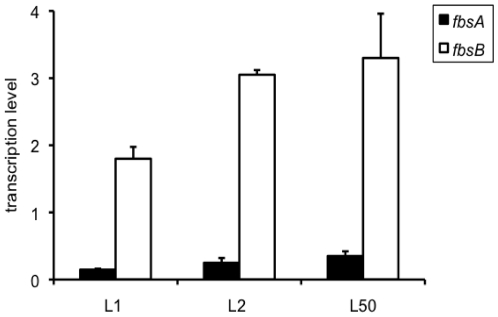
Figure 5. Transcription levels of fbsA and fbsB genes in three wild type CC17 strains.
The amount of transcripts of fbsA gene (filled boxes) and fbsB gene (open boxes) in L1, L2, and L50 wild type strains was normalized to the amount of gyrA transcripts. Each experiment was performed at least three times. Boxes are means and bars are standard deviation of the means.

