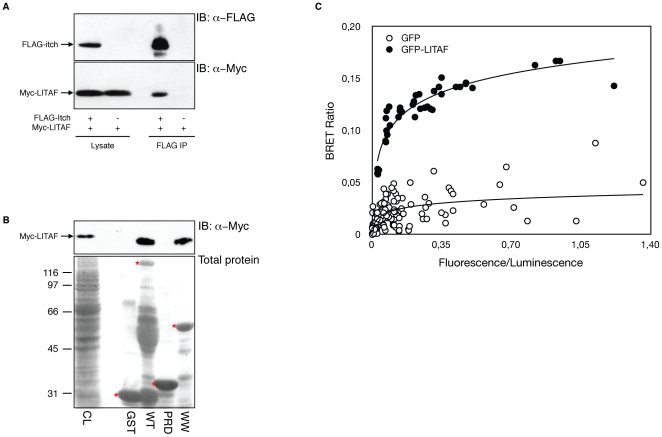
Figure 1. LITAF interacts with Itch in vitro and in vivo.
(A) HEK-293T cells were transiently transfected with FLAG-Itch with or without co-transfection of myc-LITAF. Total cell lysates were blotted with anti-FLAG and anti-myc to show protein expression (lower panel), and immunoprecipitated with anti-FLAG to reveal LITAF co-immunoprecipitation (upper panel). (B) Extracts from 293T cells transfected with myc-LITAF were incubated with either GST alone, GST-Itch WT, GST-Itch PRD or GST-Itch WW pre-coupled to glutathione-Sepharose. Input proteins is shown in the first lane (CL). Proteins bound to GST beads are shown in the next lanes. Immunoblotting with anti- myc antibodies shows the presence of myc-LITAF (upper panel). Total gel loading is shown by ponceau staining of the blot to reveal GST loading. The bands representing the GST-fusions in the Ponceau staining are marked by a red asterisk. Additional staining in the GST-Itch-WT lane likely represents degradation products of the fusion protein. (C) 293T cells were co-transfected with constant amount of rLuc-Itch and various amounts of either GFP alone or GFP-LITAF. The graph is a representative example of the saturation studies performed to provide evidence for a specific interaction between the proteins. BRET ratios were plotted as a function of the excited GFP activity to total rLuc activity ratio, allowing comparison of BRET ratios between the negative control GFP and GFP-LITAF when expressed at the same level.

