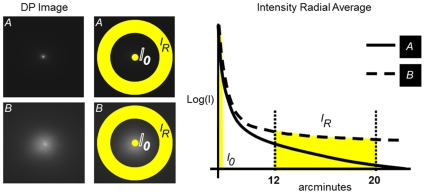
Figure 2. Example of the selection of the zone in the double-pass image used to define the objective scatter index (OSI).
We compute the relation between the intensity in the peak of the image, the central area within 1 minute, with that in a ring comprised between 12 and 20 minutes. Two DP images with different levels of scatter (A less scatter, B more scatter) are represented to illustrate the procedure.

