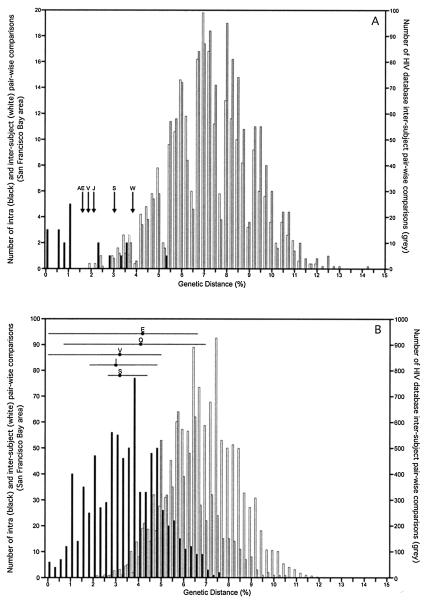
FIG. 4.
Intra- and interpatient distribution of pairwise genetic distances for the tat (A) and p17 (B) regions. The intrasubject (black lines) and intersubject (white lines) pairwise HIV-1 genetic distances for San Francisco Bay area IDUs whose variants all clustered with bootstrap values >50, as well as the intersubject distances from unrelated sequences from the HIV database (grey lines), are plotted. Arrows, intrasubject tat genetic distances for the two time points sequenced which clustered phylogenetically together with bootstrap values below 50; horizontal lines, means and ranges of the p17 intrapatient genetic distances for variants that clustered phylogenetically together with bootstrap values below 50. The phylogenetically linked subject pair AE and J was omitted from the intersubject tat distance pairs.

